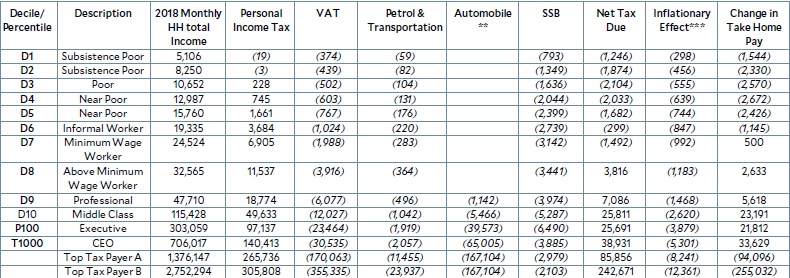
This table, from the Department of Finance, shows its estimates of
the combined impact of the “TARA sa TRAIN” (Tax Administration Reform
Act, Tax Reform for Acceleration and Inclusion) on Filipino households
(hh).
The first column breaks down the households by decile (definition:
each of 10 equal groups into which a population can be divided according
to the distribution of values of a particular variable, which in this
case is household income). Thus, you have the column listing from D1 to
D10. The highest income decile (D10) is further broken down into the top
1 percent (P100), and even further into the top 0.1 percent (P1,000).
This further subdivision is done so we can see what the tax reform does
to this elite class.
The second column describes the characteristics of each of the
deciles. Note that the bottom 50 percent of income earners are either
“Subsistence Poor,” “Poor” or “Near Poor.” Note that the “Minimum Wage
Worker” comes in the seventh decile, and the highest (tenth) income
decile is only where the “Middle Class” begins.
That decile is further broken down into “Executive,” those who belong
to the top 1 percent, and still further into the top one-tenth of one
percent are labeled “CEO.”
Now we come to the third column, which shows the 2018 monthly hh
total income by decile. The DOF assumes that each hh has two income
earners. The next seven columns give the impact of each of the tax
measures in the tax reform package plus the effect of inflation.
The
last column summarizes the final impact: the resulting change in
take-home pay. Visually, without even looking at the details, the reader
can see that the bottom 60 percent of income earners are negatively
impacted by the package (the figures are in italics, and are
parenthesized) as well as the top 0.1 percent. Those are the DOF
estimates.
To make up for the minuses, there is a complicated and not yet worked
out system of transfers that add up to P3,000 a year for the first five
deciles and P1,500 for the next two (up to the seventh decile). BUT:
This is relief that lasts only four years. WHY ONLY FOUR YEARS? No one
who has critiqued my stand has answered.

Source: DOF staff estimates using the preliminary Family Income and Expenditure Survey- Labor Force Survey 2015
Notes: Each household has about two income earners
*Total household income includes compensation income, income from
entrepreneurial activities (i.e. businesses) and other sources of income
(i.e. cash transfers)
**Automobile excise tax impact was computed using 2016 prices, assuming 5 years of amortization
***The inflationary effect was computed as a function of income,
marginal propensity to consume (MPC), and estimates on the price effect
of the increased oil excise on the price of food


No comments:
Post a Comment